The Truth of the U.S. Economy Behind the Data: Key May Indicators Reveal Multiple Challenges
A series of U.S. macroeconomic data released in May 2025 acts as a mirror, reflecting the complex current state of the U.S. economy and providing crucial decision-making basis for market participants and policymakers. These data cover key areas such as economic growth, employment, and inflation, uncovering the challenges and opportunities facing the U.S. economy at this stage.
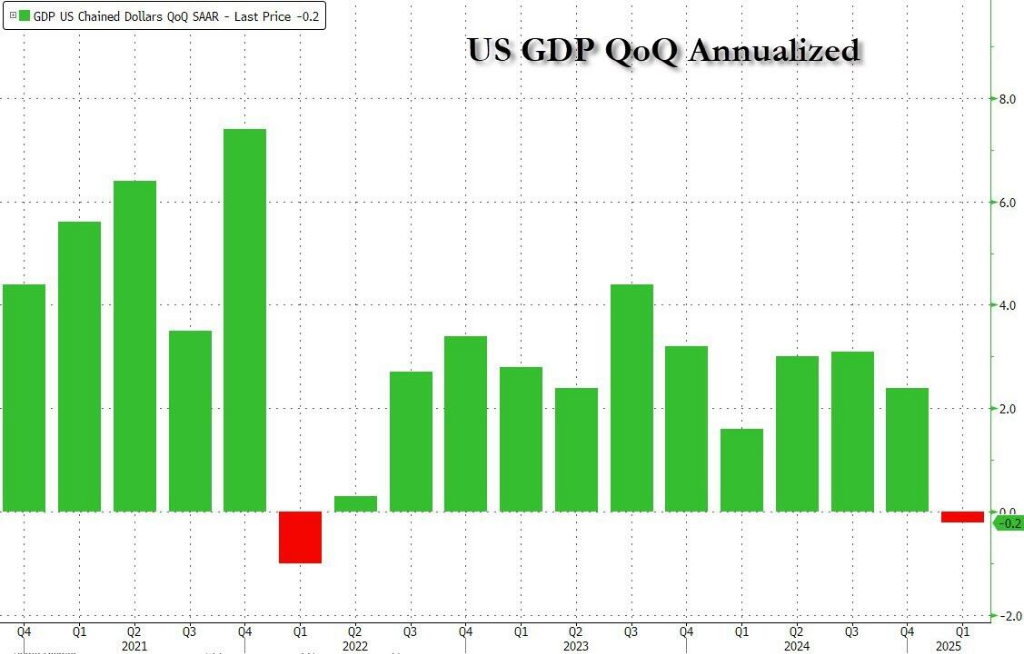
GDP Contraction Shows Warning Sign
On May 6, the U.S. Commerce Department reported that Q1 economic data showed GDP contracted by 0.3% quarter on quarter, far below the market forecast of 0.5% growth—the first negative growth since 2022. This data undoubtedly cast a shadow over the U.S. economic momentum, triggering widespread concerns about the risk of recession.
In terms of data structure, personal consumption expenditure fell by 0.2% quarter on quarter, with durable goods consumption dropping by 3.7%, indicating that consumers have reduced their willingness to spend amid economic uncertainties. As a major driver of U.S. economic growth, changes in consumer behavior have a profound impact on the overall economy. For example, when consumers worry about future economic prospects, they may cut purchases of durable goods like cars and home appliances, affecting production and sales in related manufacturing sectors.
Non-residential fixed investment dropped by 1.4%, reflecting greater corporate caution in investment decisions. Reduced corporate investment may stem from factors such as increased market demand uncertainty, tighter financing environments, and concerns about trade policies. In such cases, enterprises may postpone or cancel investment projects, thereby impacting long-term economic growth potential.
Net exports also dragged down GDP by 0.5 percentage points, a factor not to be overlooked. Against the backdrop of an unstable global trade environment, U.S. exports face multiple challenges, while rising imports exert competitive pressure on domestic industries. For instance, some U.S. enterprises may opt for imports due to lower prices, to some extent suppressing the development of domestic related industries.
Mixed Signals in the Labor Market
The April non-farm payroll data released on May 2 showed a complex labor market landscape. Non-farm payrolls increased by 177,000, exceeding the forecast of 138,000, while the previous figure was revised down from 228,000 to 185,000. The unemployment rate remained stable at 4.2%, in line with expectations and the previous value. Average hourly earnings rose by 3.8% year on year, in line with the previous figure but slightly below the forecast of 3.9%.
Although April's non-farm payroll growth slowed from the previous month, it still exceeded expectations. By sector, the service industry remained the main contributor to employment, though showing a marginal slowdown from March: sectors with high economic elasticity such as retail, catering, and accommodation weakened, while transportation and warehousing saw a significant month-on-month increase. Hourly earnings in the private sector grew more slowly month on month. The unemployment rate stayed stable, and the labor participation rate rose slightly. Overall, the resilient labor market may prompt the Fed to maintain a cautious stance, but the impact of tariff policies on inflation still requires attention.
Overall, despite the better-than-expected non-farm data, weakening consumption-related employment figures and revised-down job growth indicate persistent pressure in the labor market. First, the structure of April's non-farm data was less than healthy: while employment growth in transportation and warehousing rebounded, its sustainability is questionable, while employment in retail and hospitality—reflecting consumer willingness—weakened significantly. Second, data from the U.S. Bureau of Labor Statistics showed that February's non-farm payroll growth was revised down from 117,000 to 102,000 (the initial value was 151,000, revised down twice consecutively), and March's figure was revised from 228,000 to 185,000. After these revisions, the combined job growth in February and March was 58,000 lower than previously reported.
Moderating Inflation Pressure
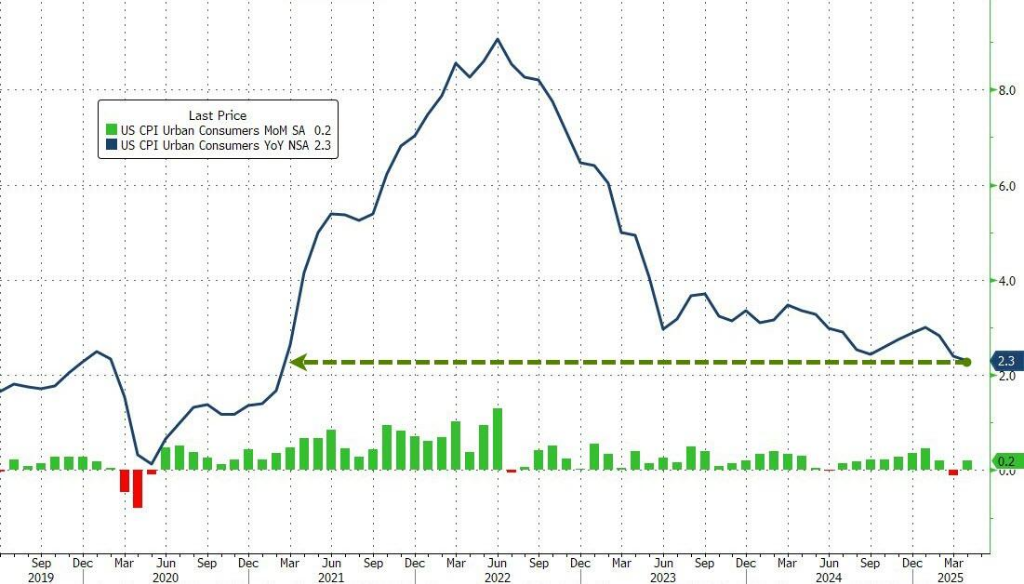
The April CPI data released on May 13 showed that U.S. CPI rose by 2.3% year on year in April, down from 2.4% in the previous month and below the market forecast of 2.4%; core CPI increased by 2.8% year on year, in line with both the previous figure and market expectations. Overall, U.S. inflation continued its downward trend.
Following March's CPI decline below expectations, April's CPI did not significantly reflect the price pressure from tariffs, with modest month-on-month changes in core goods, core services, and housing costs.
Energy prices continued to fall year on year, supporting low inflation. In April, energy prices dropped by 3.7% year on year, 0.4 percentage points lower than the previous month. Among them, gasoline prices fell by 11.8% year on year (down 0.1% month on month after seasonal adjustment). In April, affected by OPEC+ production increases and global demand cooling triggered by tariff wars, international oil prices dropped significantly. However, natural gas prices rose year on year, mitigating the decline in energy price growth. Commodity inflation ended its year-on-year decline, with the impact of tariff policies on commodity prices emerging but not yet significant. Core goods prices rose by 0.1% year on year in April, mainly due to a lower base in the same period last year, with a month-on-month increase of 0.1%, 0.2 percentage points higher than the previous month.
By major category, new vehicle and clothing prices grew more slowly month on month, while used car prices fell at a slower pace. Service inflation continued to ease, with core services rising by 3.6% year on year in April, down 0.1 percentage point from the previous month, and up 0.3% month on month. Housing inflation remained basically stable, with owner equivalent rent falling slightly to 4.3% year on year and rent holding steady at 4% year on year. In addition, transportation service prices declined year on year, and with the labor market cooling moderately, service inflation pressure is expected to continue easing.
Considering that April's CPI did not fully incorporate the impact of tariff policies, the low year-on-year growth rate in April may not be sustainable. As U.S. actual tariff levels remain high, and the lagged effects of tariff policies gradually emerge, inflation is likely to rebound, with the magnitude partly depending on the direction of tariff policies after the 90-day moratorium ends. Due to U.S. enterprises "rushing imports and hoarding inventories" in Q1, absorbing costs by depleting inventories or temporarily refraining from raising consumer prices, April's CPI data did not fully reflect the impact of tariff policies, meaning the low 2.3% year-on-year growth in April is unlikely to persist.
For the full year, after a technical low in Q2, CPI growth is expected to pick up in Q3 and Q4.
Surprising Drop in PPI Data
On May 15, data from the U.S. Bureau of Labor Statistics showed that U.S. PPI fell by 0.5% month on month in April, the largest decline in five years, against a forecast of 0.2% growth, with the previous figure revised up from -0.4% to 0%; core PPI dropped by 0.4% month on month, against a forecast of 0.3% growth, with the previous figure revised up from -0.1% to 0.4%. The unexpected month-on-month decline in PPI was mainly due to falling profit margins, indicating that enterprises absorbed part of the impact from rising tariffs.
Looking at year-on-year data, U.S. PPI rose by 2.4% in April, better than the forecast of 2.5%, and down from 2.7% in the previous month; core PPI rose by 3.1% year on year, in line with expectations and slightly slower than the previous 3.3%. Behind these figures lies the pricing dilemma faced by U.S. manufacturers and service providers. Although producers are bearing cost pressures from imported materials and other inputs due to aggressive tariffs, most have chosen to avoid passing higher U.S. import tariffs to downstream users. A recent Atlanta Fed business inflation expectations survey showed that less than one-fifth of enterprises said they could fully pass on a 10% cost increase.
In terms of price composition, the PPI report showed that prices of goods excluding food and energy rose by 0.4% month on month in April, but food prices fell for the second consecutive month, with egg costs dropping by more than 39%, and energy costs falling for the third consecutive month. Final demand service prices fell by 0.7%, the largest decline since 2009 when data became available, with more than 40% of the decline attributed to falling wholesale profit margins for machinery and vehicles. It is worth noting that some components of PPI are used to calculate the Fed's preferred inflation gauge, the PCE price index. Affected by declines in portfolio management and airfare, these categories mostly weakened, with only healthcare showing an increase. This means changes in PPI may also have a chain reaction on subsequent PCE price index and the Fed's policy judgment.
Slower Retail Sales Growth
Also on May 15, data from the U.S. Commerce Department showed that U.S. retail sales grew by only 0.1% month on month in April, better than the market forecast of flat growth but far below the significantly revised 1.7% growth in March, up 5.2% year on year, close to the highest level since December 2023. By segment, retail sales excluding auto sales grew by 0.1% month on month, below the market forecast of 0.3%; the key "control group" sales fell by 0.2% month on month, in stark contrast to the expected 0.3% growth, directly casting a shadow over the Q2 economic start as this data affects GDP calculations. Adjusted for inflation, retail sales rose by 2.8% year on year, matching the highest level since February 2022.
Behind this meager growth lies a clear slowdown in consumer spending. Among the 13 commodity categories covered by the report, sales in 7 categories fell, with sporting goods, gas stations, and clothing hit the hardest, while car sales—previously driven by panic buying—also declined slightly. In contrast, building materials saw the largest sales increase, and food service sales grew significantly for the second consecutive month. As the only service category included in the retail report, this performance reflects consumers' cautious attitude toward non-essential spending.
The "brake" on consumer spending is closely related to the "overdraft" of purchasing power caused by massive purchases to avoid Trump's tariff policies. Now, facing rising prices and tariff-related concerns, consumers are tightening their spending. This change has intensified market worries about economic slowdown, with enterprises, investors, and economists all adopting a cautious stance on the outlook. The current deterioration in consumer sentiment also confirms the economic pressure signaled by retail data from the side. While tariffs have not yet triggered inflation—April consumer price growth was lower than expected—and declines in service prices such as airfare and hotel rates also indicate a drop in consumer discretionary spending, echoing the performance of retail data.